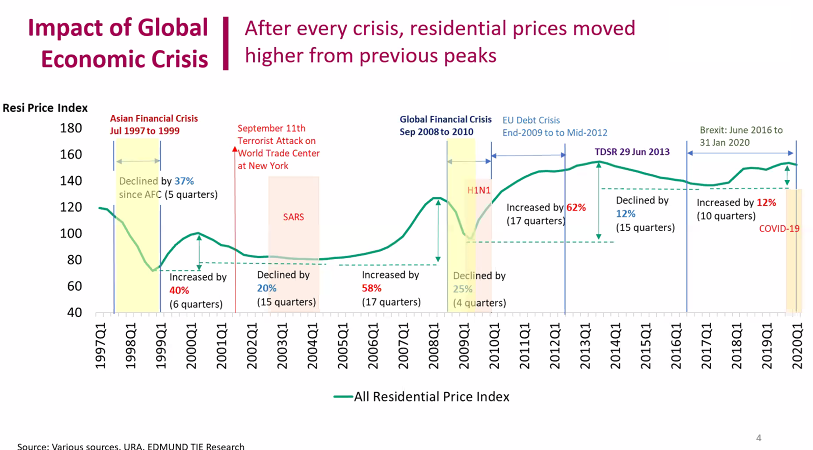
One of the common questions I get from readers is whether I have studied the impact of the Asian Financial Crisis (AFC) and the Global Financial Crisis (GFC) on our Singapore Property Market and how it compares to what we are going through today.
In fact, I have and have shared my findings in March with my team before the lock down began.
While honestly, it is impossible to triangulate whether the current COVID situation would be similar to the prior economic crises, the knowledge of how markets have rebounded in the past does provide solace (whether rationally or not) for concerned property owners and investors.
Humanity always feels safer when we have something to cling on to, to reassure ourselves during distressed times.
Through the charts and analysis in this article, i hope to bring you some clarity on how the past events have panned out and my best guess on property prices moving forward.
Let’s begin with the Asian Financial Crisis in 1997.
Impact of the Asian Financial Crisis on the Singapore Residential Property Market
The full brunt of the Asian Financial Crisis hit our shores in July 1997.
As you will see in the following chart, private market volumes suffered a decline the immediate months after and subsequently recovered only 9 months later.
PRIVATE MARKET (VOLUME) DURING AFC
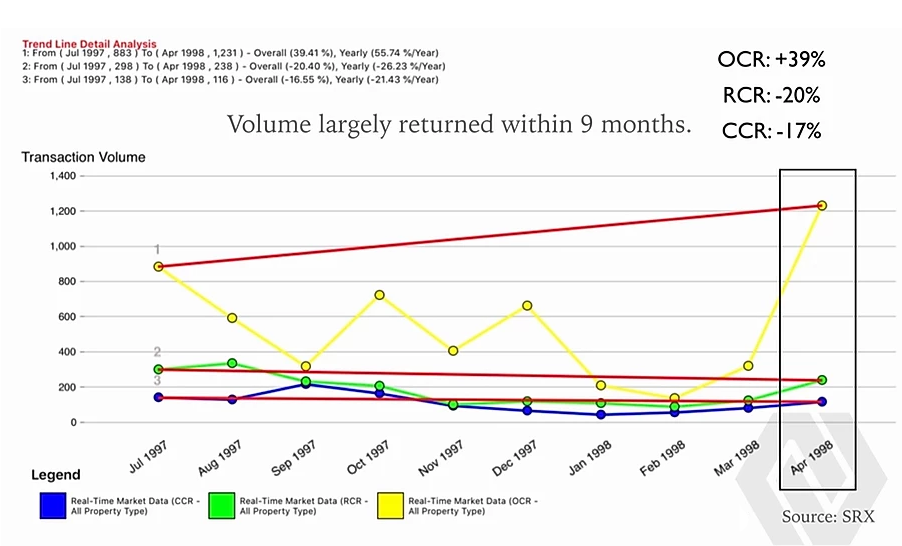
The impact to transactions volume for the 1st 8 months period were the least in the CCR region at -42%, followed by the RCR region at -59% and the deepest impact was in the OCR region at -64%.
This could be due to the availability of liquid assets by the affluent market to continue buying into prime properties while the masses, with their jobs in limbo and with less bullets on hand, took a more conservative stance and put off their buying decisions.
However when the buying volume returned on the 9th month, the month on month volume in the Core Central Region (CCR) bounced back by 45%, Rest of Central Region (RCR) bounced back by 94% and the Outside Core Region (OCR) recovered by a stunning 286%.
This can be attributed to the pent-up demand by mass market buyers who had greater visibility and confidence in a recovery by March 1998.
PRIVATE MARKET (AVERAGE PSF PRICE) DURING AFC
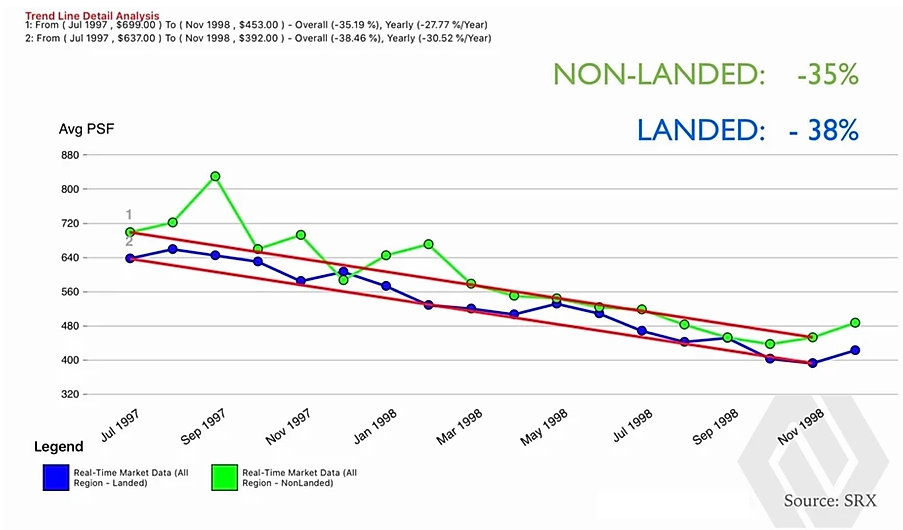
It is noteworthy to point out that prices started correcting more significantly only after 3 months from the full impact of AFC hitting our shores.
When volumes decreased, naturally supply & demand dynamics witnessed further softening of prices and the decline in prices continued until the market bottomed out in November 1998.
This bottoming out of prices took 7 months after the recovery in volume illustrated in the previous graph.
By then landed home prices had corrected by -38% and non landed private homes by -35%.
PRIVATE NON-LANDED AVERAGE PSF CORRECTION BY REGION
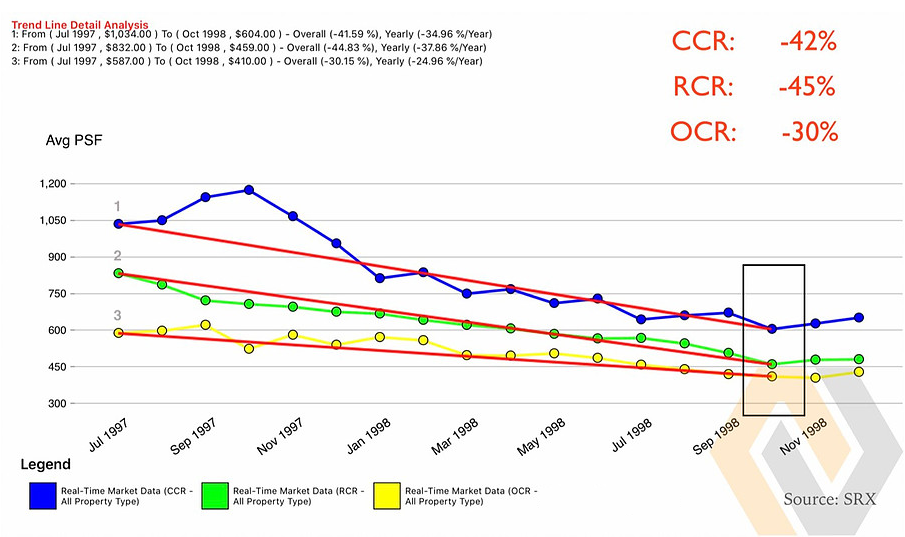
Zooming into the average per square foot (PSF) performance of each region, the bottoming out of private non-landed prices happened between Oct and Nov 1998.
By then, the OCR region had corrected by -30%, the RCR region by -45% and the CCR region by -42%.
It seemed that the Asian Financial Crisis impacted all segments of the population almost similarly.
PRICES REBOUNDED TO PAST HIGHS WITHIN 14 MONTHS OF BOTTOMING OUT
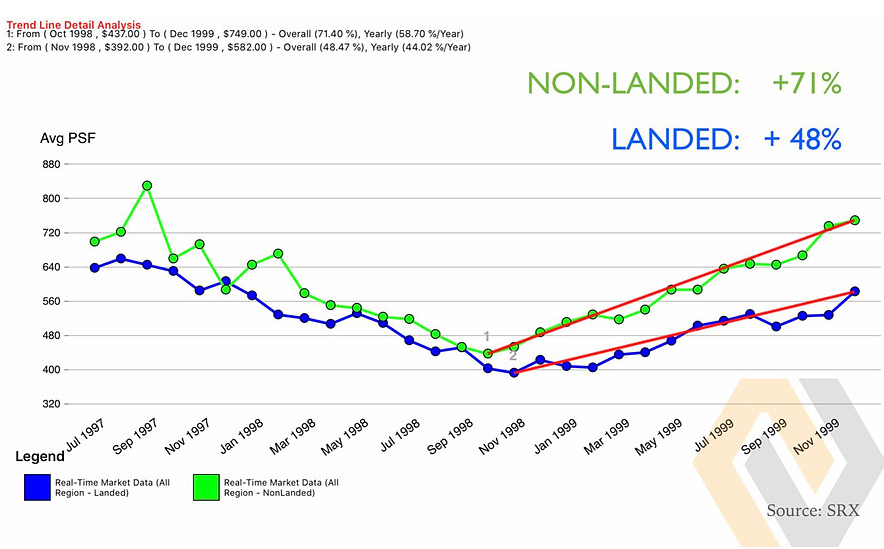
When the green shoots of recovery started sprouting in Nov 1998, prices rebounded near to pre-crisis highs within 13-14 months of the bottoming out.
Land properties appreciated by 48% and non-landed condominiums and apartments appreciated by 71%.
In total, it took approximately 2 years and 4 months for the property market to reach a full recovery to previous price heights.
HDB VOLUME TREND DURING AFC
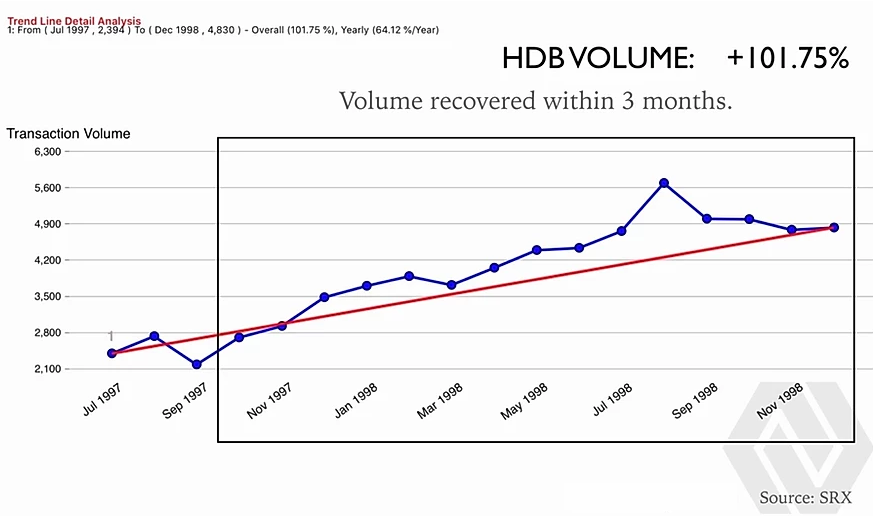
On the HDB side, volumes were not adversely impacted and conversely, went up significantly.
This is due in part to the incomes affected population downgrading to public housing from their private properties, hence greasing the wheels of the HDB market.
HDB AVERAGE PSF PRICE TREND DURING AFC

Despite the rise in volume in the HDB flats market, market sentiments at the point were still largely pessimistic and as a result, prices corrected by an average of 22.5%.
A lesser dip as compared to the private market but nonetheless significant.
However, interestingly, the recovery to pre-crisis levels in HDB average per square foot prices took almost 5 times longer, at approximately 11 years.
PRICE RECOVERY OF HDB MARKET TOOK 11 YEARS AFTER AFC
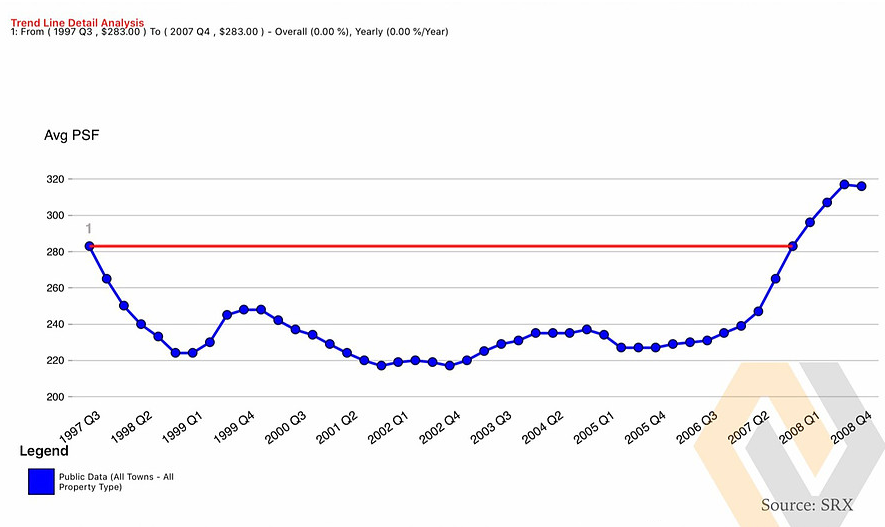
The lost decade post-AFC for HDB owners was painful, irreversible and perhaps one of the main reasons why many preferred to invest in and hold private properties in subsequent cycles.
Now, let’s move on to what happened during the Global Financial Crisis of 2008.
Impact of the Asian Financial Crisis on the Singapore Residential Property Market
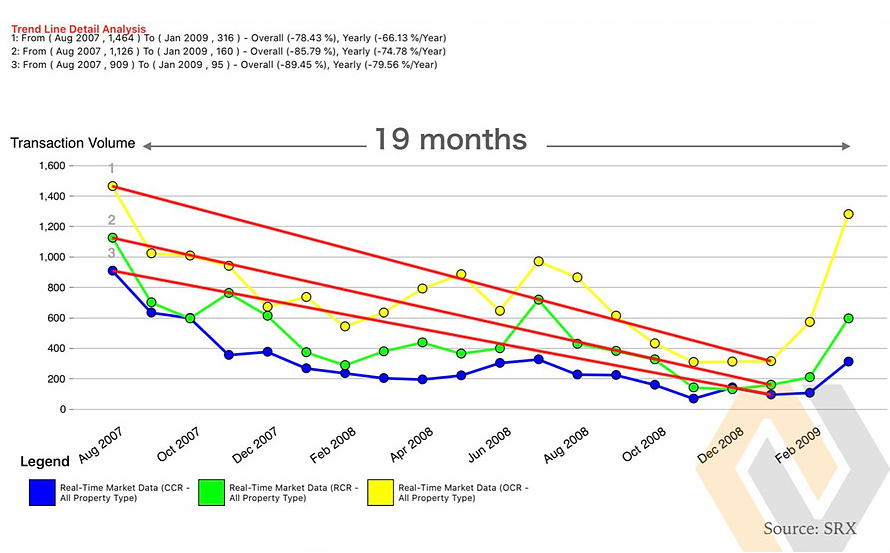
The GFC’s impact to transactions volume was more severe and took 19 months before a significant recovery in volume took place.
PRIVATE PROPERTY MARKET SALES VOLUME DURING GFC
This time round, unlike during AFC, landed property prices corrected only by 18% while condominiums and apartments corrected similarly substantially as before by 42%.
In total, the bottoming out in prices took 18-19 months.
RECOVERY IN PRIVATE NON-LANDED MARKET TOOK 14 MONTHS AFTER BOTTOMING
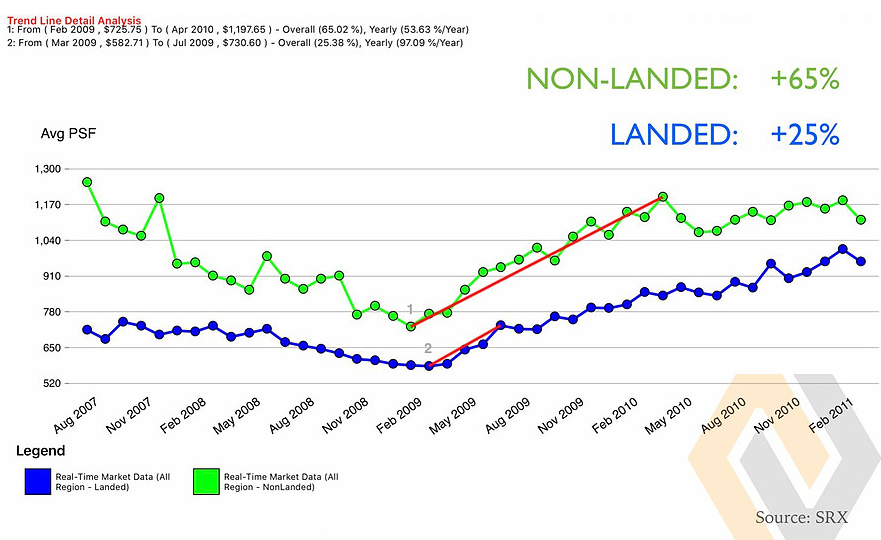
The subsequent recovery for condominiums and apartments took 14 months from bottoming out, which was about the same time taken during the AFC, while the landed property market interestingly reached its pre-crisis levels within 4 months of bottoming out in Feb 2009.
In total, GFC took the market 2 years and 8 months to recover to its past price highs.
PRIVATE NON-LANDED AVERAGE PSF CORRECTION BY REGION
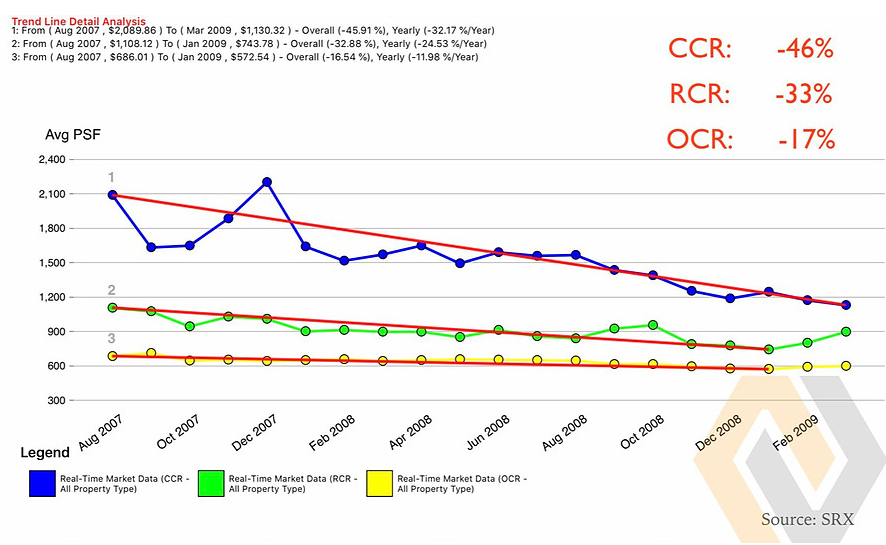
Region-wise, the Core Central Region bore the brunt of the price correction at -46% while RCR corrected -33% and OCR region corrected by only -17%.
It appears that the impact of GFC affected the higher networth markets more than it did to the entire market; which is quite different from AFC‘s impact on everyone from HDB to high end markets.
HDB TRANSACTION VOLUME TREND DURING GFC
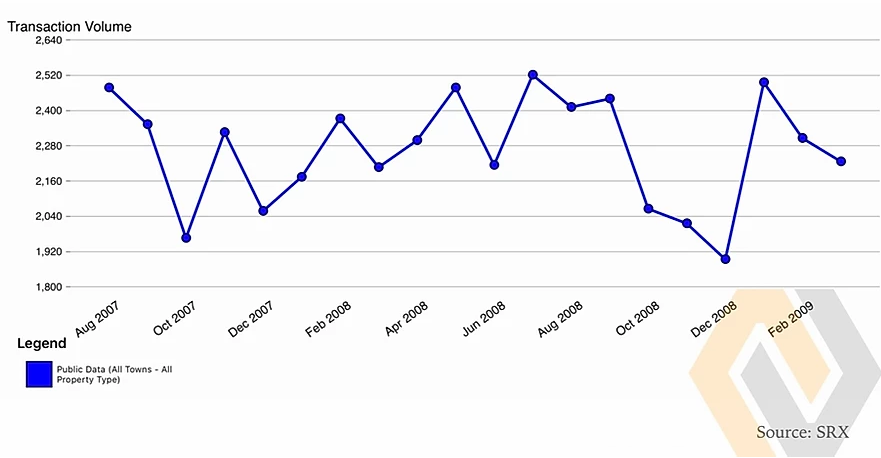
Over the same period, HDB volumes were pretty much unaffected with volumes dipping in the immediate 2 months but bouncing back by the 3rd (As Dec and Jan are typically lull months and dips are expected).
HDB PRICE TREND BY AVERAGE PSF DURING GFC
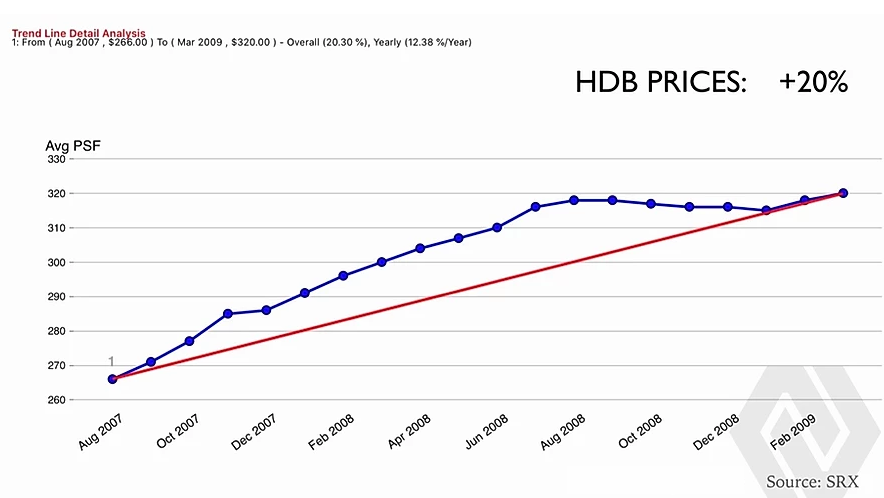
As we observed earlier, GFC affected the higher networth markets more than the mass market.
And we can further deduce this by the way HDB prices bucked the trend during the same period of correction that the private market was going through.
By March 2009, HDB prices had appreciated by 20% and many owners were ready to arbitrage the market by taking advantage of private housing price discounts and upgrading opportunities.
This subsequently fuelled the 6 years property bull run that spanned 2009 – 2013.
Closing thoughts
When we look back to 2020 in the not too distant future, it is likely that the commencement of our Circuit Breaker on April 7 2020 will signify the beginning of this property market chapter.
As I have stated earlier, it is impossible to make logical comparisons with past crises while facing starkly different uncertainties in our current one.
At best, we can comfort ourselves and hope that the money printing tsunami, SURF (Solidarity, Unity, Resilience and Fortitude Budget) and low interest rates do enough to prop up jobs and prices till we are ride out the waves to calmer waters.
In the last 2 months, we have seen how transaction volumes in all segments have dipped significantly, and discounts and price corrections emerging in both the new launches and resale market.
There have been pockets of decent sales volume amid developer discounts at selected projects such as Kopar at Newton, Parc Clematis, Florence Residences and Parc Esta but the majority of projects have seen muted action thus far.
It remains to be seen how we will sail through this but quietly my gut tells me that the resale market, with larger units and higher price quantum than most current new projects, will face alot more downside pressures in the coming days.
Established developers are entering this storm with robust balance sheets, thin profit margins and expectations of further government support for their enterprise and the thousands of jobs on the line.
As long as they still believe in the Singapore story and “management‘s track record”, we can expect that they resist initiating major price corrections that are counter productive to the economy as a whole.
Resale owners on the other hand, will largely have to fend for themselves after the temporary relief measures end, while the impending reduced affordability of the masses will restrict buyers from stretching their budget for an older but larger resale property even if they wanted to.
Does this mean that i am advocating a wait and see approach?
No, i believe that in crisis lies great opportunity. And recently, have been making offers for properties myself.
Hopefully you too can gain clarity on what steps to take next for your property investment journey.
Need an opinion on your property investment plans or the best buys in the market today?
Get a 1-time free 30 min Property Wealth Planning consultation. Whatapps me at 91838484 now
A PWP consultation includes:
- An in-depth financial affordability assessment
- Highly relevant investment insights
- A clear and customised investment road map for your real estate investment journey.
- A curated list of the best buys in today’s market with good upside potential and minimal risks
- Selecting the best unit in a project with higher profit potential.